English
 Español
Claims Processing Systems: A Rollout Plan
A claims processing systems rollout guide covering workflow readiness, knowledge migration, role-based learning, QA governance, and adoption.
Read More

Schedule a demo to see how a connected performance dashboard unifies BPO KPIs across clients, cuts admin time by 30-40%, and boosts agent retention.
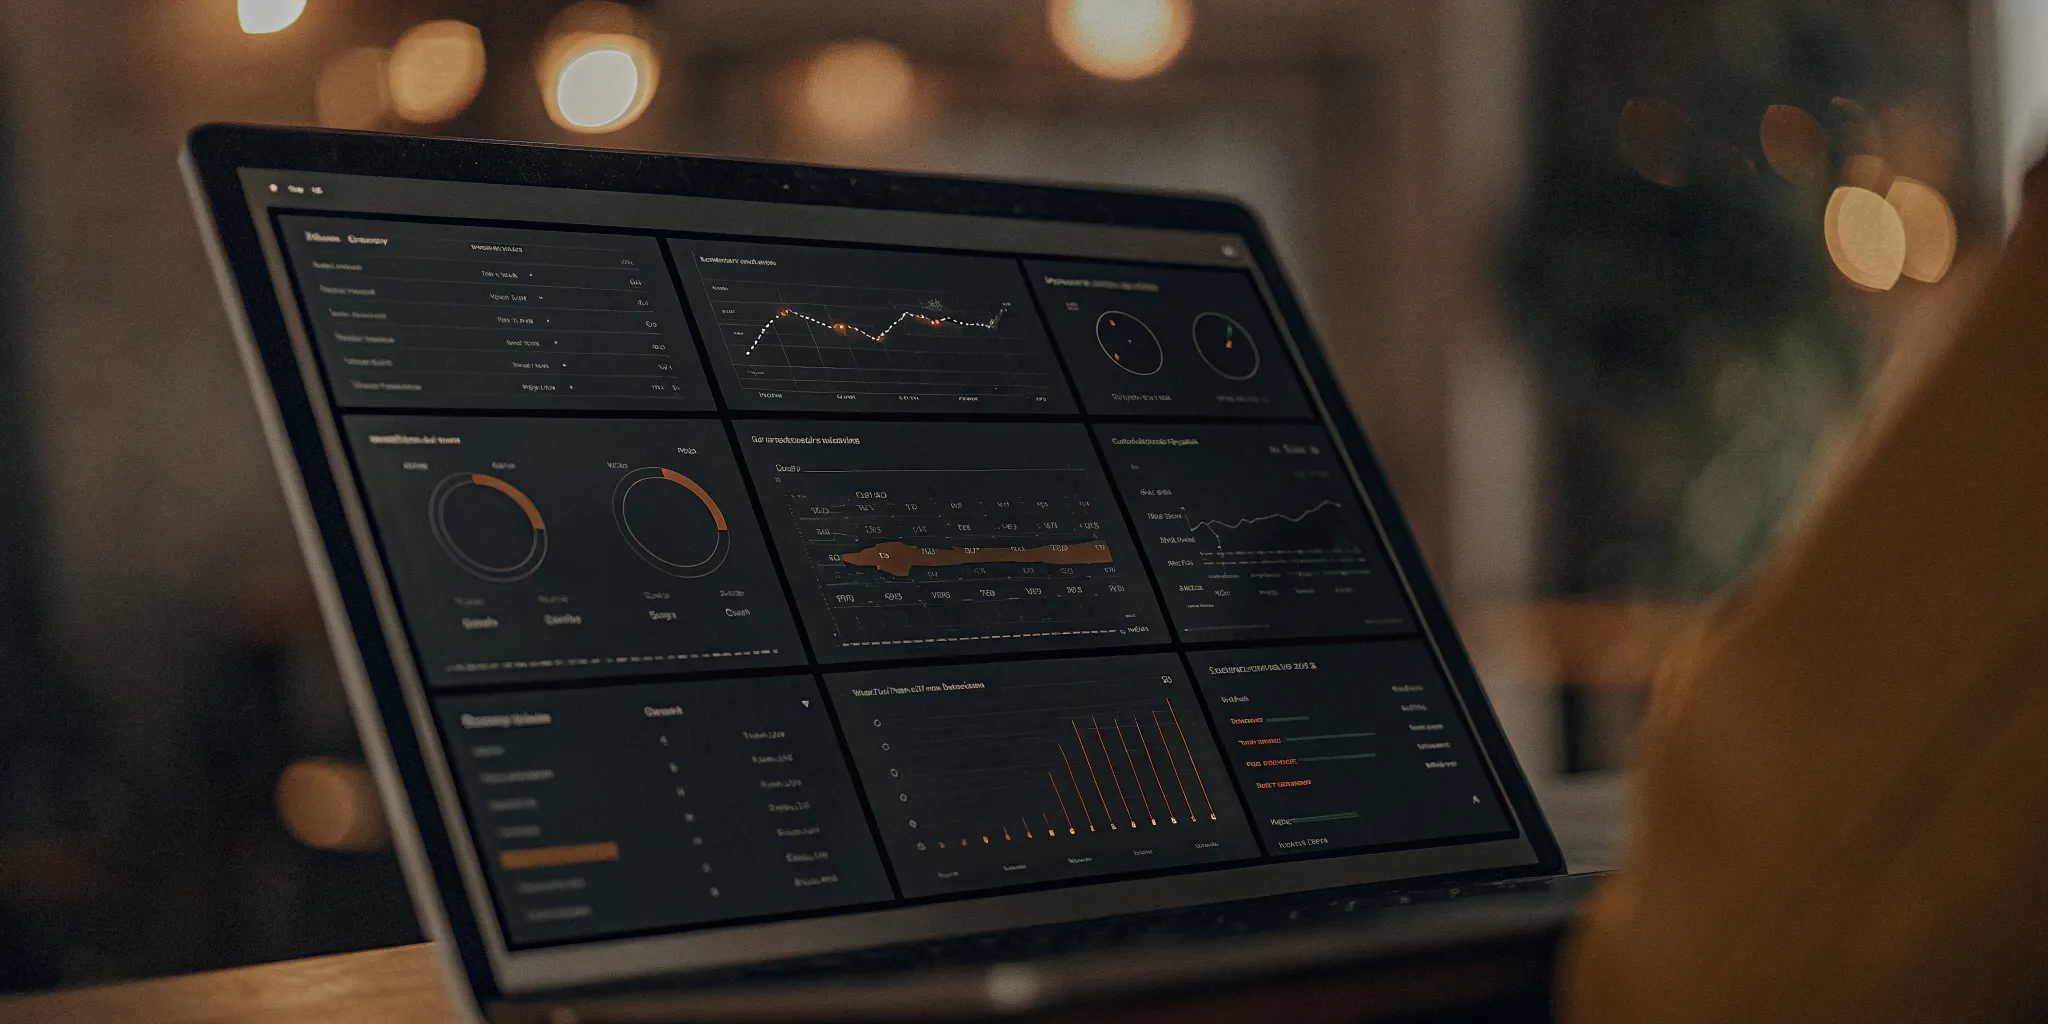
BPO supervisors spend nearly forty percent of their workdays on admin tasks instead of coaching their agents. This burden grows when tracking performance on many client accounts. A unified approach helps leaders focus on development, and a connected performance dashboard is the tool that makes this possible by pulling data from CRM and CCaaS systems into one clear view.
Schedule a demo to see how C2Perform's connected performance dashboard can unify your multi-client KPIs and give your supervisors back 30-40% of their day for coaching.
Managing these complex client goals requires a clear plan that fits a multi-client environment perfectly. This path to better visibility begins with understanding why traditional reporting methods fall short in modern contact centers.
A connected performance dashboard acts as a single tool that pulls data from CRM and CCaaS systems into one clear view for BPO supervisors. This tool removes the need to check seven different apps to see how a team is doing against their specific client SLAs and metrics. By unifying these metrics, leaders can cut their daily admin work by 40 percent while giving agents better support through employee performance dashboards. Research shows that linking call center tools is key to better results and helps lower the 60 percent attrition rates common today.
Business Process Outsourcing (BPO) leaders face a unique hurdle: managing work across many clients. Each client brings their own Key Performance Indicators (KPIs), Service Level Agreements (SLAs), and tools. This mix often leads to a messy work space where data sits in different spots. Without a connected performance dashboard, leaders struggle to see how teams perform for each account in real time.
Most BPOs use three to seven separate tools to track agent work. These tools include CRM systems, phone apps, and logs. When these systems do not talk to each other, managers must pull data into sheets by hand. Research shows that integrating call center technology can help teams work better. But for many, this task takes 30% to 40% of a supervisor's day. This time should be spent helping agents, not moving data between tabs.
Every client has different rules for success. One client might focus on how fast agents answer calls. Another may care more about solving issues on the first try. Tracking these goals across a large team is hard. A connected system acts as one layer that brings all this data together. This helps BPO managers see work across many clients at the same time. This view is key for spotting trends before they hit SLA targets or hurt client trust.
Separate systems do more than slow down managers; they also hurt agent morale. High turnover is a big issue in contact centers, and a lack of clear feedback is a main cause. By using one interface, leaders can link data to coaching and growth plans. This single view helps drive consistency and helps keep employees. When agents see that their work is tracked fairly and they get the help they need, they stay with the firm longer.
A connected performance dashboard is more than just a graph on a screen. For most call centers, a standard dashboard only shows data from one tool at a time. This is what we call a point tool. It might show your wait times or your call counts, but it does not show the full story of how your team is doing. A connected tool pulls data from all your systems into a single view. This gives leaders a clear look at their work without having to jump between many tabs and apps. It acts as a main layer that joins your tools together to save time and reduce stress.
Connected dashboards differ from standard tools because they pull data from every system into a unified interface. Instead of logging into five separate apps to understand team performance, BPO leaders can view all client KPIs, agent metrics, and SLA compliance from one screen. This unification removes the manual data-gathering step that consumes 30-40% of supervisor time and replaces it with real-time visibility.
Most contact centers use five to seven different tools every day. These include your phone system for calls, your CRM for client data, and your WFM for staff plans. When these tools do not talk to each other, you have data silos. This makes it hard to see how a change in one area affects another. Using connected performance systems helps you link these tools. By pulling all this data into one place, you can see how your agents are doing in real time.
A true connected system uses a unified data model. This means all the facts from different sources speak the same language. C2Perform works with the tools you already use. It links with phone systems like Five9, Nice inContact, Genesys Cloud, and RingCentral. It also connects to CRM tools like Salesforce, Zendesk, and Microsoft Dynamics. This setup allows BPOs to work across 30 countries and use 14 different languages. Since the data is unified, you do not have to spend hours trying to make sense of different reports. The system does the hard work for you so you can focus on helping your team grow.
BPO leaders face tough tasks when they manage many clients at once. A connected dashboard gives you a clear view into many client accounts at the same time. This is vital for staying on top of your work. The system also includes version control. This feature tracks who made a change, who created new content, and who gave their approval. This is helpful for teams in regulated fields where you must keep a clear record of your work. Key features that matter most for multi-client BPOs include:
Managing a multi-client BPO needs a clear view of how each team works. A connected performance dashboard gives leaders the data they need to stay ahead. Recent reports show that 64% of business leaders believe these tools give their firm a big edge. By linking systems, you can see real-time data and past trends in one place. This makes it easy to prove your value to new and current clients.
Every BPO dashboard should track SLA compliance, First Call Resolution (FCR), Customer Satisfaction (CSAT), quality scores, and agent coaching completion rates. These metrics tell you if your teams are meeting client goals, following brand guidelines, and growing in their roles. A connected dashboard slices these by client account so you can see which accounts need attention without digging through spreadsheets.
The most basic metrics for any BPO are Service Level Agreement (SLA) goals and First Call Resolution (FCR). A dashboard lets you slice this data by client to show clear views. This pulse of work helps team leads find issues before they grow. High-performing teams use these views to fix gaps and keep clients happy. Without a single view, you might miss a small dip that turns into a large breach. Tracking these in real-time ensures that you always meet your promises.
Linking data is the key to good tracking. Research shows that integrated performance systems help leaders place staff much better. When your dashboard links to your phone tools, you get a live pulse of every agent and queue. This makes it easy to spot which clients need more help at any given time. You can move agents between tasks to cover spikes in volume, which keeps your SLA scores high for everyone.
Customer Satisfaction (CSAT) and inside quality scores tell you if your agents meet brand rules. You can use your dashboard to compare these scores across different client tasks. This helps you find which training paths work best for each group. You can then use those wins to help other parts of the business. Seeing these scores in one place helps you spot which teams need a new approach to keep quality high.
Measuring agent performance involves more than just speed. You should track how well agents follow rules and use knowledge tools. By tracking these in connected performance systems, you ensure every client gets the same high level of care. It also makes it easy to show clients exactly how you meet their unique goals. Sharing these results builds trust and helps you keep long-term partnerships.
Staff turnover is a major cost for BPOs, so tracking engagement is vital. Metrics like coaching completion rates and turnover signs can warn you about risks. If coaching scores are low, agent performance often follows. A good dashboard tracks these trends over time so you can act fast to save your best talent. Using historical data lets you see patterns in when agents start to disengage.
Connected tools let you turn data into action. When a dashboard shows a dip in performance, it can trigger a new coaching task for that agent. This closed-loop process ensures that every agent gets the help they need to grow. Tracking these steps helps you prove the value of your leader team to your clients. It shows that you do not just watch the numbers but also invest in the people who drive them.
Teams at multi-client BPOs often face a tough task when they track work. They must pull data from many tools to get a clear view of their results. A connected performance dashboard acts as a central hub for this data. It helps operations leader tools stay on top of goals across many client projects. This setup reduces the time spent on admin tasks by 30-40%.

The Team tier provides the core tools needed for a strong business layer. It includes KPI tracking that lets you see how every agent is doing now. These dashboards pull data from outside sources and internal files to show a full picture. Using these tools helps teams keep operational consistency across their contact center systems. It also gives leaders a way to run contests to keep agents happy.
This level of sight is key for keeping your staff focused on the right goals. You can set up action plans that start as soon as a KPI falls below a target. The system also handles attendance rules and runs polls to check team health. These tools help managers spend less time on paperwork and more time on coaching. This makes the day run better for everyone.
The Plus tier adds to the core tools with deep C2View data views. This tool gives you two-click dashboards that show trends over a long time. It is a big help for teams that need to find patterns in large sets of data. Business leaders find that robust analytics strategies are vital for staying ahead. This tier lets you see how different facts affect each other across your whole firm.
With Plus, you also get a builder to create tests for your staff. This helps link gaps in work directly to new training tasks. The system keeps track of every change with version control to meet high standards for your clients. This makes sure that your dashboard is not just a list of numbers. It is a path to better work and better results for your clients.
| Capability | Team Tier | Plus Tier |
|---|---|---|
| KPI Tracking | Standard view | Advanced data |
| Leaderboards | Included | Included |
| Reporting | Basic tracking | C2View tools |
| Action Plans | Automated | Automated |
| Staff Tests | Surveys | Test builder |
A connected performance dashboard does more than just show numbers. It links what is going on now to the steps you take to improve. For BPOs, this means moving from just seeing a problem to fixing it fast. When data flows into coaching, your team can grow. They stay steady and do good work for every client you have. This link between data and growth is what helps your business scale.
The strongest BPOs use their dashboard data to trigger targeted coaching actions. When a quality score dips below a client's threshold, the system automatically assigns a coaching session with relevant eLearning content. This closed loop ensures no agent falls through the cracks and every coaching minute is backed by data, not guesswork.
Team leads often spend too much time getting ready for coaching talks. In fact, leads often spend 30% to 40% of their day on desk work instead of helping their team. Using a platform that links data to action can change this. AI-enhanced coaching notes can cut the time spent on prep work by 30-40%. This lets leads spend more time on BPO performance coaching where it counts the most. It moves the focus from hunting for data to having helpful talks with agents.
When you have all the facts in one place, you can see trends across different clients. This is vital for BPOs that need to meet many sets of goals at once. By cutting down on the time spent on prep, your leads can focus on the human side of the job. This helps agents feel heard and secure in their roles.
Building a loop where data drives growth helps keep the best people on your team. Research shows that tracking performance in a unified way leads to better use of your team's time. This process makes sure that every agent gets the help they need at the right time. It turns a simple metric into a clear path for an agent to get better at their job.
A closed-loop system means no one gets left behind. When QA results link right to coaching, the path to better work is clear. Studies show that using data to find quality gaps helps teams reach higher goals with more success. This kind of connected performance dashboard helps you manage work better and keep your team for a longer time. You can see up to a 52% jump in how many people stay with your company when you use these tools.
This method also helps your team do more each day. By making these steps part of your day, you can see a 60% boost in how much work gets done. It takes the guesswork out of management. Instead of guessing who needs help, the data tells you exactly where to go. This leads to a more fair and clear workplace for everyone involved.

Managing several clients at once adds many layers of work for a BPO. Each client has unique goals and ways of working. Using many single tools to track these needs often leads to gaps in data. A single platform helps leaders see the whole picture. It brings all client data together so teams can work more clearly.
Many BPOs use five to seven different tools to track how their teams do. This tool sprawl forces leaders to spend too much time moving data between systems. By using one interface, teams can improve BPO performance management and focus on results. This change can cut the time spent on office tasks by 30% to 40%.
When data stays in one place, it is easier to find the truth. Leaders no longer have to check many lists to find one answer. This speed allows for better resource use and faster checks of agent work. It also makes sure every client gets the same high level of care. The main benefits of platform consolidation include:
In fields like insurance or finance, rules are very strict. Teams must follow exact steps for every talk with a customer. Using knowledge management tools makes it easy to keep these rules in one spot. This helps keep work steady even when switching between different client accounts.
Version control is also a key part of this process. It tracks who made or changed content. This is a must for groups that work in sectors where every word matters for safety or law.
Adding a new client is a big task. A connected performance dashboard makes it faster to get new teams ready. It sets a clear path for what success looks like from day one. Clients can also see their own data in real time. This builds trust because they can see the work being done.
Better tools also lead to happier teams. When agents have the right quality assurance tools, they feel more sure of their work. This can lead to a 52% rise in retention and more steady output. As a BPO grows, having one strong base makes it much easier to scale up. Many firms even see a 60% boost in productivity after they fix their workflow.
These tools help by bringing data from many places into one view. This stops leads from having to switch between five or seven other apps. According to C2Perform, this change can cut the time spent on task work by 30 to 40 percent. By saving time on chores, leads can focus more on helping their teams grow.
Links are vital because BPOs often work for many other clients at the same time. Each client has their own set of rules and systems. A tool that links to all these systems gives a full view of work on one screen. This helps leads see how every team is doing without logging into many tools.
To build a live tool, you must link your phone system and task data to one place. This link lets you see live updates on how agents are doing. Once you link your tools, you can track key stats like wait times and call quality as they happen. This helps you find and fix problems fast.
The main goal is to give teams a clear way to see and track their goals. It helps both agents and leads know if the work they are doing meets client needs. Seeing all data in one place helps teams spot problems before they grow.
Handling several clients without one view of the numbers leads to missed goals, high stress, and gaps in the service you provide. Every day your supervisors spend toggling between five separate systems is a day they could have spent coaching agents and improving client outcomes. A connected performance dashboard removes this friction by unifying all client KPIs, quality scores, and coaching data in a single pane of glass.
C2Perform's Team and Plus tiers give BPOs the flexibility to start with core KPI tracking and scale to advanced analytics as your needs grow. With integrations for Five9, Genesys, Salesforce, and more, you can connect your existing tools without replacing them.
Schedule a demo to see how C2Perform can help you build a connected performance dashboard that cuts admin time, improves agent retention, and keeps every client SLA on track.